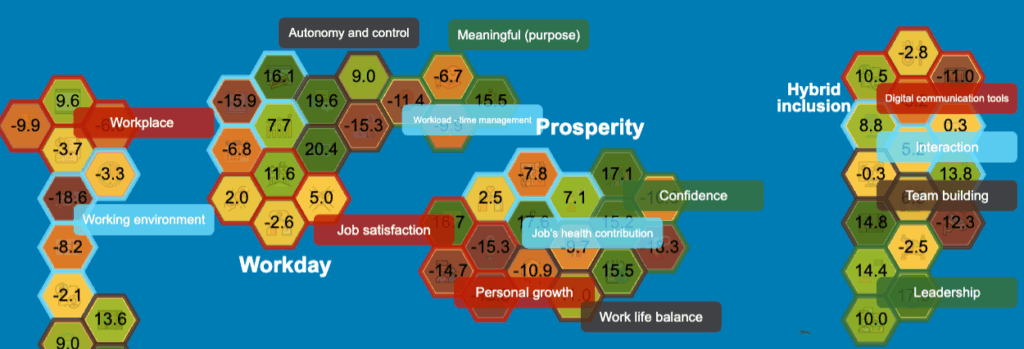
• People can be more easily involved if the 80 data points are visualized in a comprehensible way.
• A shared “social dashboard” for cities, companies, schools, or neighborhoods.
• Everyone understands which levers they themselves can move.
• People can be more easily involved if the 80 data points are visualized in a comprehensible way.
• A shared “social dashboard” for cities, companies, schools, or neighborhoods.
• Everyone understands which levers they themselves can move.