Digital Democracy
The HSOS model offers the possibility to make social systems readable, manageable, and understandable – without losing individuality, but with a clear focus on the collective patterns that make development possible.
Transparent Visualization
The 80 data points are translated into a simple, visual form (e.g., a social dashboard). Everyone can see which areas are “strong” or “weak”: trust, conflict resolution, information quality, autonomy, belonging. Self-diagnosis and navigation tools help individuals and groups recognize their position.
Self-Reflection & Feedback
Individuals can mirror their own behavior against the data points: “Where am I contributing to stability? Where am I blocking growth?” Peer feedback (e.g., in teams, neighborhoods, associations) is oriented toward these points instead of purely subjective judgment.
Concrete Fields of Action
Each data point is linked to practical action options:
- If trust is low: here’s how you can contribute in daily life.
- If conflicts escalate: these communication rules help.
Grassroots initiatives can launch small interventions with big impact.
Collective Learning
Instead of central control, swarm learning emerges: groups compare their profiles, learn from each other, adapt. Best practices spread horizontally through networks, not top-down.
Self-Reinforcement through Recognition
Positive contributions to stability & growth are made visible and rewarded (badges, recognition systems, social credits). People experience directly: “My behavior improves the community.”
Bottom-Up Error Culture
Errors are not punished but treated as data for improvement. Grassroots groups can experiment locally, measure feedback, and spread successful patterns.
Participatory Governance
Decisions in associations, communities, or initiatives are based on the data points with less ideology, more evidence. Individuals understand why a decision is made and can help shape the process.
Scalability from Small to Large
Starts in small cells (neighborhood, school, project group). Patterns that work locally can be transferred to other contexts. Thus, an organic governance grows from the bottom up.
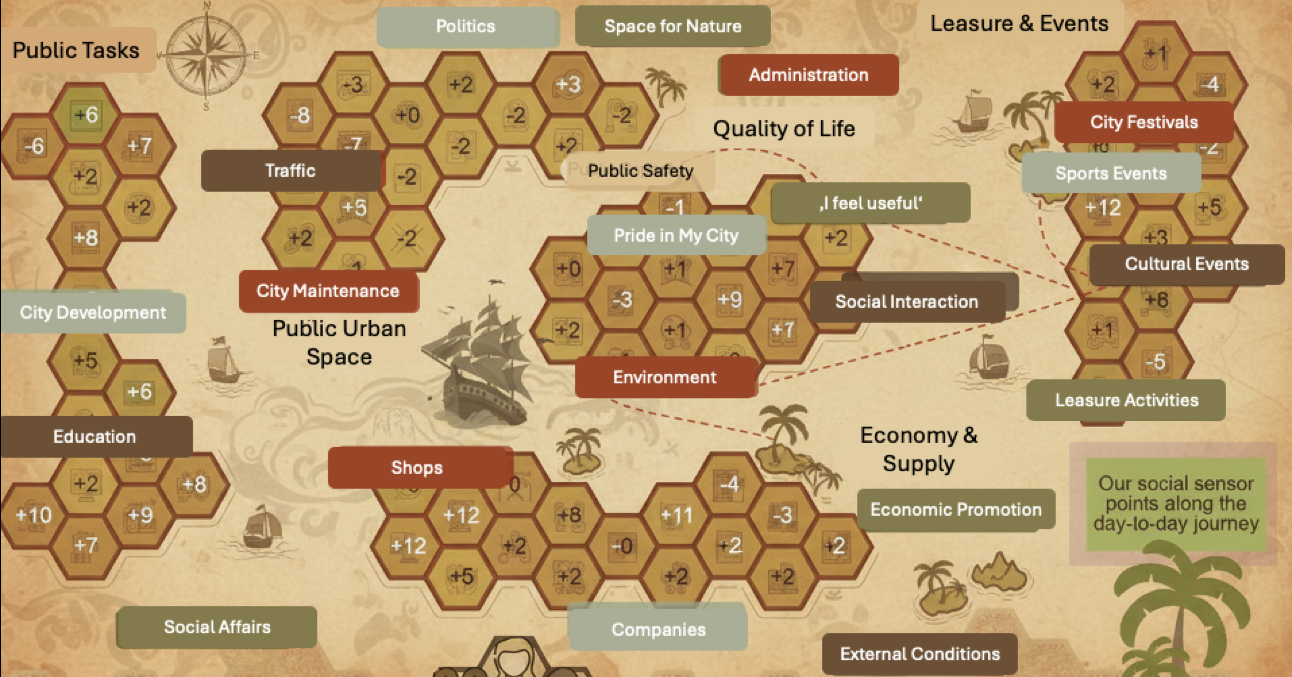
The Small Town Ecosystem
In a small town, everyday life is shaped by the interaction between individual needs and public welfare. The HSOS system works like a social sensor network:

Community feedback
Citizens continuously provide input on public tasks, administration, events, safety, shops, education, and social life. This feedback highlights strengths (+) and weaknesses (–) across the tuchpoints and anchorpoints.
Adaptive adjustment
Rather than relying on static planning alone, the system evolves gradually. Conflicts, events, or changes in city maintenance become visible early. Community members discuss them, balance perspectives, and co-adapt everyday practices and policies
Integrations of perspectives
Individual experience: how useful, safe, or connected people feel
Public interest: how decisions align with fairness, sustainability, and shared resources.
Local economy & culture: shops, festivals, and external conditions.
Dynamic equilibrium
Over time, this interplay leads to a fit between individual expectations and community needs. The town becomes more resilient and sustainable by integrating diversity of views into a shared navigation framework.
Digital Democracy in Action
A Gamified Community Development Tool
HSOS can not only serve as a diagnostic framework, but also as a foresight engine. It can turn social dynamics into structured, comparable scenarios, helping groups to see multiple possible futures and negotiate the best common path forward. This resembles the approach of early strategic computer games. Now it is possible to feed theses games with relationship data in a dynamic context.
City Dashboard (Current State)
- Visual Layout:
- Center: City map with clusters (e.g. Economy, Social, Culture, Infrastructure).
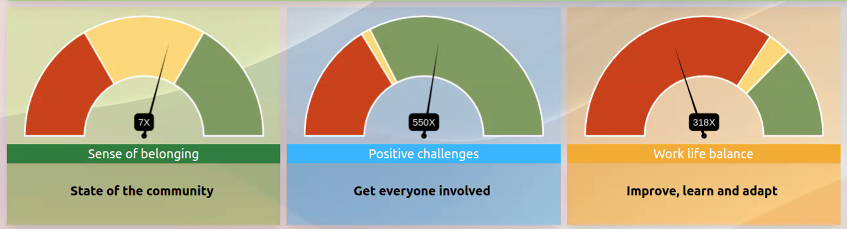
- Metrics Panel:
- Quality of Life Index (%)
- Economic Vitality Score
- Social Cohesion Index
- Sustainability / Environmental Footprint
- User Action: Quick overview, identify first weak spots.
Simulation Panel (Decisions & Effects)
- Left Column: Actions to choose from
- “Build park”
- “Subsidize cultural events”
- “Attract startups”
- “Improve public transport”
- Right Column: Real-time simulation results
- +12% Citizen Satisfaction
- -5% Budget Balance
- +8% Traffic Flow
- Visualization: ripple animations across the hexagons, showing chain reactions.
Strategy Map (Long-Term Planning)
Timeline View (5–10 years)
Player places “strategy stones” along a path: Infrastructure, Social, Economy.
Each step shows combination effect
More culture and higher attractiveness attracts companies, but requires infrastructure and increases cost.
Trade-offs visible
Balance between growth, sustainability, and satisfaction.
- Voting Panel: Citizens vote or rank which projects they value most.
- Community Heatmap: topics that matter glow as “hot zones” on the city map.
- Feedback Loop: Simulation adapts to citizen preferences.
Game Mode (Workshop / Training)
Use Cases: Workshops, education, citizen participation, business training.