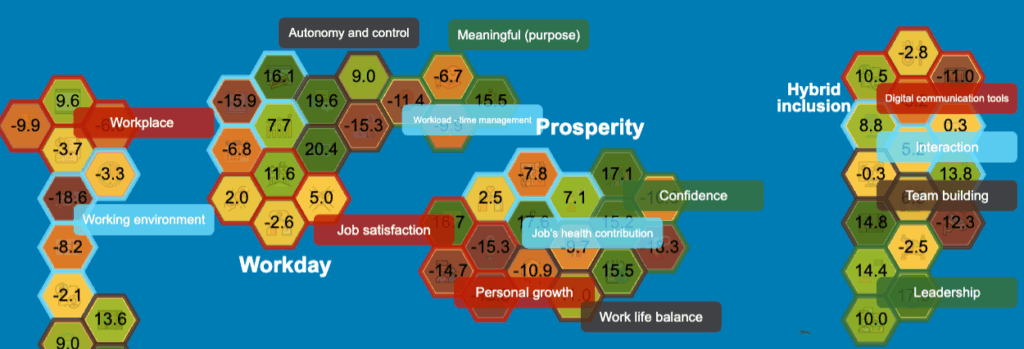
• The 80 data points are translated into a simple, visual form (e.g., a social dashboard).
• Everyone can see which areas are “strong” or “weak”: trust, conflict resolution, information quality, autonomy, belonging.
• Self-diagnosis and navigation tools help individuals and groups recognize their position.